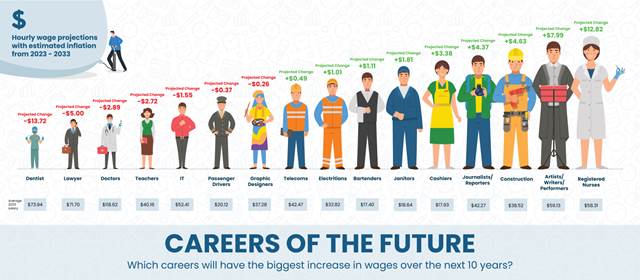
New research has ranked the U.S.’ most populated industries and estimated what their pay could look like in 10 years (2033) in line with inflation, and the results are surprising.


The research by TollFreeForwarding.com found registered nurses are expected to make $12.82 more per hour in 2033 than they do today, the highest increase of the 16 professions included in the study.
Interestingly, artists, writers, and performers are expected to see the second highest increase in hourly earnings, with an adjusted $8 rise in 2033 from 2023. According to the Bureau of Labor Statistics, a continued demand for live music and digital media opportunities will continue to drive growth in the arts. The BLS projects entertainers and performers to see a 6% growth over the next decade, while artists and writers will see a 4% growth. The increases for lower-wage workers can somewhat be attributed to states raising their minimum wage requirements and a competitive labor market.
Dentists are expected to see the sharpest decrease in earnings, making $13.72 less per hour by 2033, followed by lawyers, who are estimated to earn $5.00 less per hour, and doctors, who are estimated to make $2.89 less per hour. Despite the decrease in hourly wages, all three professions project to be among the highest earners in 2033, with doctors expected to earn $150 per hour, dentists $93.95 per hour and lawyers $90.34 per hour, the three highest of all included professions.
The complete findings are as follows:
|
Career |
2013 Hourly Earnings |
2013 (adjusted) |
2023 Hourly Earnings |
2033 Projected Earnings |
2033 (adjusted) |
|
Doctor |
$92.25 |
$121.03 |
$121.51 |
$150.72 |
$118.62 |
|
Dentist |
$81.19 |
$106.52 |
$87.66 |
$93.95 |
$73.94 |
|
Lawyer |
$63.46 |
$83.26 |
$76.70 |
$90.34 |
$71.70 |
|
Artists/Writers/Performers |
$28.77 |
$37.75 |
$51.14 |
$75.14 |
$59.13 |
|
Registered Nurses |
$33.13 |
$43.47 |
$45.49 |
$74.09 |
$58.31 |
|
IT |
$41.51 |
$54.36 |
$53.96 |
$66.59 |
$52.41 |
|
Telecoms |
$30.45 |
$39.95 |
$41.46 |
$53.97 |
$42.47 |
|
Journalists/Reporters |
$23.26 |
$30.52 |
$37.90 |
$53.72 |
$42.27 |
|
Teachers |
$35.08 |
$46.02 |
$42.88 |
$51.02 |
$40.16 |
|
Construction |
$25.59 |
$33.57 |
$33.89 |
$48.94 |
$38.52 |
|
Graphic Designers |
$27.70 |
$36.34 |
$37.54 |
$47.37 |
$37.28 |
|
Electricians |
$25.75 |
$33.78 |
$32.33 |
$41.70 |
$32.82 |
|
Passenger Drivers |
$15.59 |
$20.45 |
$20.49 |
$25.56 |
$20.12 |
|
Janitors |
$12.09 |
$15.86 |
$16.83 |
$23.69 |
$18.64 |
|
Cashiers |
$9.82 |
$12.88 |
$14.55 |
$22.78 |
$17.93 |
|
Bartenders |
$10.46 |
$13.72 |
$16.29 |
$22.11 |
$17.40 |
TollFreeForwarding.com spoke to recruiter and Head of People Renae Shaw to understand some of the factors that could be impacting the estimated increases and decreases.
“In recent years we’ve seen a lot of pressure on salaries as inflation and the cost of living continues to rise,” says Shaw. “This can be seen in industries like Digital Marketing, where a skills shortage is keenly felt. This will be compounded further as AI become more prevalent, and we can expect to see the gap widen further in other industries also. Demand for certain roles will drop dramatically, and subsequently the salaries, and we can expect to see new trends emerging.”
Methodology
Earning Forecasting
We gathered the annual mean hourly earnings for each job from 2013 to 2022 from the Bureau of Labor Statistics. Using this historical data, we forecasted what each job would make every year from 2023 until 2033 using the Excel function FORECAST.ETS(target_date, values, timeline).
Adjusting for Inflation
Historical earnings were then adjusted for inflation in 2023 using the US inflation calculator. Future projections were also adjusted for an estimated ten-year inflation rate of 2.13% (21.3% cumulative) based on projections by the Federal Reserve Bank of Cleveland. Future earnings adjusted for projected inflation were calculated using the formula (X – (X*0.213)) and checked against the future inflation calculator.
Earnings Differences (Actual Values)
The actual difference in earnings from 2013 to 2023, and 2023 to 2033, were calculated using the unadjusted historical and projected earnings for each job.
Earnings Differences (Adjusted Values)
The adjusted difference in earnings from 2013 to 2023, and 2023 to 2033, were calculated using the adjusted-for-inflation historical and projected earnings for each job.


