No, it isn’t – not if we look at the rest of the world. We’ve all heard that testing is a measure of how effectively a country is responding to the COVID-19 pandemic. It not only helps us identify cases for treatment, it also enables contact tracing to identify other cases and control the spread of the pandemic. But how do we measure testing? And which countries are doing well? We’ll see that the U.S. does not score high.
It’s been said that the U.S. has performed more testing than the rest of the world combined. Not so – while the U.S. had reported 4.7 million tests through 4/23, that’s only 19% of the 24.7 million tests reported worldwide. And that worldwide total excludes both China, which provides no test information to the WHO, and Taiwan, which has been hailed for its strong response to the pandemic, but which has no relationship with the WHO.


The U.S. has been especially hard-hit by COVID-19. Only four countries with populations above 5 million have seen more cases per capita; fully 33% of the world’s reported cases are in the U.S. It stands to reason that the number of tests a country performs must depend partly on how widespread the pandemic is in that country. Even so, while we’ve had nearly one-third of the world’s cases, we’ve only performed less than one-fifth of the tests.
It’s widely understood that (1) a significant amount of testing is driven by simply the number of cases, and (2) additional testing beyond that is strategic and preventive. Comparing total cases to tests performed will give us a sense of how well a nation addresses both objectives. To level the playing field, we must look at both metrics on a per-capita basis. The following graph compares 45 countries, which collectively have reported 90% of the world’s COVID-19 cases:
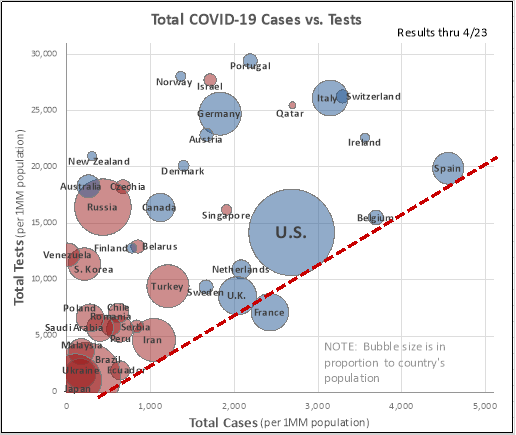
The bubble graph format enables us to add a third dimension of information: the country’s population. Also, the “wealthy west” datapoints – western Europe, U.S., Canada, Australia, and New Zealand – are colored differently. The wealth and sophisticated healthcare systems of that group of countries should put them at the forefront of using testing as a preventive measure, especially since many of them have been hit so hard by COVID-19.
The upward-sloping red line added to the graph reflects the notion that some amount of testing is driven simply by caseload. Countries right on that line are doing the minimum testing necessary to manage the existing cases. Countries that sit well above that line are using testing strategically, to identify hard-to-spot cases and to manage the future spread of the pandemic. Of the countries with more than 1,000 cases per 1MM population, only a few – Iran, U.K., France, Belgium, and Spain – sit right up against that red line. Not only is each one of those countries among the countries hardest hit by the pandemic, they tend to have a significantly higher case fatality rate (CFR) – that is, total deaths divided by total cases – than the other countries shown (with the tragic exception of Italy). Belgium’s CFR, for example, is the highest in the world, other than tiny San Marino’s. A lower CFR may be partly explained by the fact that more testing uncovers more asymptomatic or mild COVID-19 cases.
Compared to the other countries, the U.S.’s testing per capita is in the middle of the pack. But no country with as many cases per capita has performed fewer tests per capita. Russia, for example, has done more testing than the U.S., even though it has reported less than one-fifth the number of cases per capita than the U.S. And Venezuela, with only a few hundred reported COVID-19 cases, has done nearly as much testing per capita as the U.S. (if Venezuela’s information is accurate).
All this data suggests that countries are addressing the testing challenge in wildly different ways. The data also suggests that the countries having the hardest time with the pandemic tend to be the ones doing the least amount of testing. More effective, better organized testing must be a top priority at all levels in the U.S.
[A FINAL NOTE: Four of the datapoints – Iceland, Luxembourg, San Marino, and the UAE – don’t appear on the graph because they all reported more tests than 30,000 tests per MM – the highest value on the vertical axis scale. Iceland deserves special mention because as of 4/23 it had performed 45,000 tests; with a population of 341,000, that’s an astonishing 132,000 tests per MM – by far the highest rate in the world. Also, while Iceland’s 5,243 cases per MM is one of the highest per-capita figures in the world – which isn’t surprising when you’re testing so many people – it has reported only 10 fatalities, for a CFR of only 0.6%.]