
U.S. home prices continued their upward trajectory in the first quarter of 2022, with year-over-year growth averaging around 20%, allowing 62,000 owners to regain equity compared with the previous quarter. Homeowners in California, Hawaii and Washington led the U.S. for annual equity increases in the first quarter of this year, all gaining more than $100,000. Only 2% of homeowners with a mortgage remain underwater, a slight decline from the fourth quarter of 2021.
“Price growth is the key ingredient for the creation of home equity wealth,” said Patrick Dodd, president and CEO at CoreLogic. “Home prices were up by 20% in March compared to one year earlier in CoreLogic’s national Home Price Index. This has led to the largest one-year gain in average home equity wealth for owners and is expected to spur a record amount of home-improvement spending this year.”


Negative equity, also referred to as underwater or upside-down mortgages, applies to borrowers who owe more on their mortgages than their homes are currently worth. As of the first quarter of 2022, the quarterly and annual changes in negative equity were:
- Quarterly change: From the fourth quarter of 2021 to the first quarter of 2022, the total number of mortgaged homes in negative equity decreased by 5.3% to 1.1 million homes, or 2% of all mortgaged properties.
- Annual change: In the first quarter of 2021, 1.4 million homes, or 2.6% of all mortgaged properties, were in negative equity. This number decreased by 23%, or approximately 300,000 properties, in the first quarter of 2022.
Because home equity is affected by home price changes, borrowers with equity positions near (+/- 5%) the negative equity cutoff are most likely to move out of or into negative equity as prices change, respectively. Looking at the first quarter of 2022 book of mortgages, if home prices increase by 5%, 130,000 homes would regain equity; if home prices decline by 5%, 167,000 properties would fall underwater.
Figure 1: Map of Average Year-Over-Year Equity Gain per Borrower
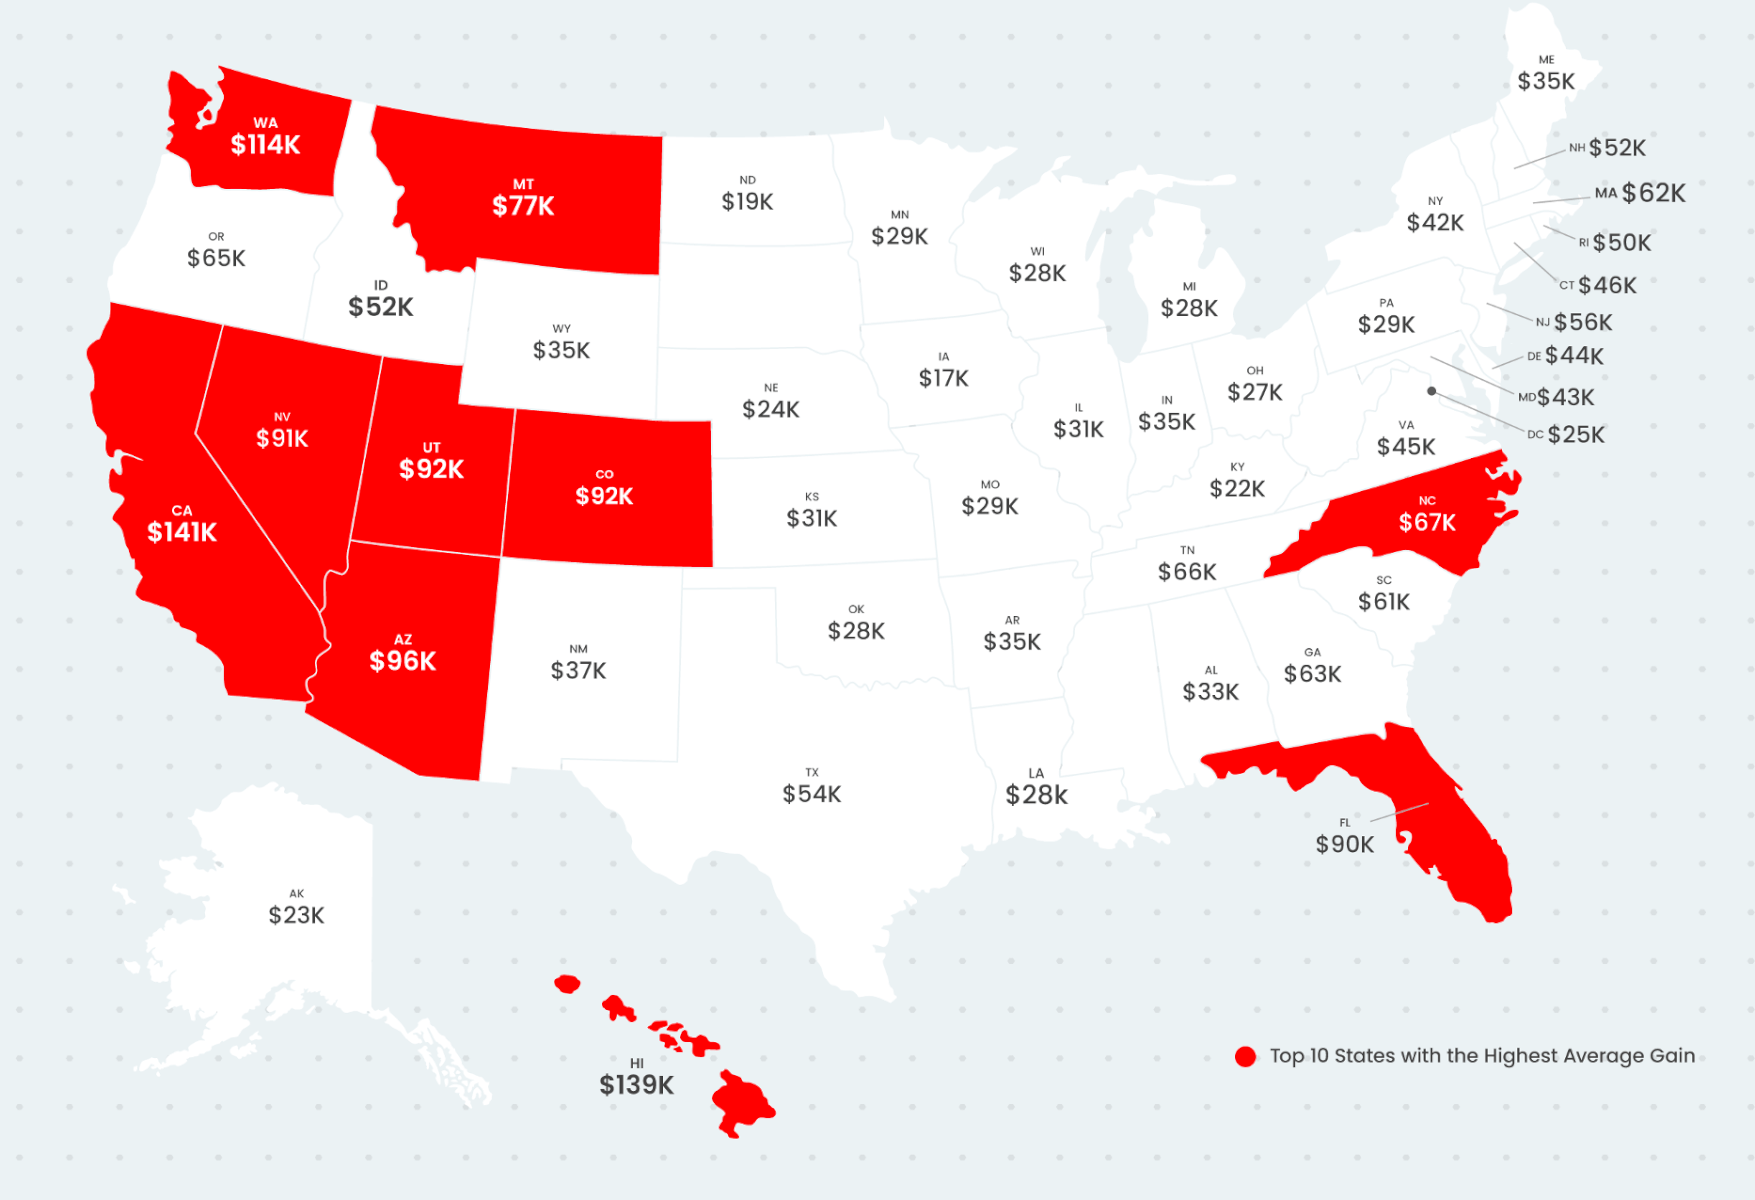
Figure 2: National Home Equity Distribution by LTV Segment
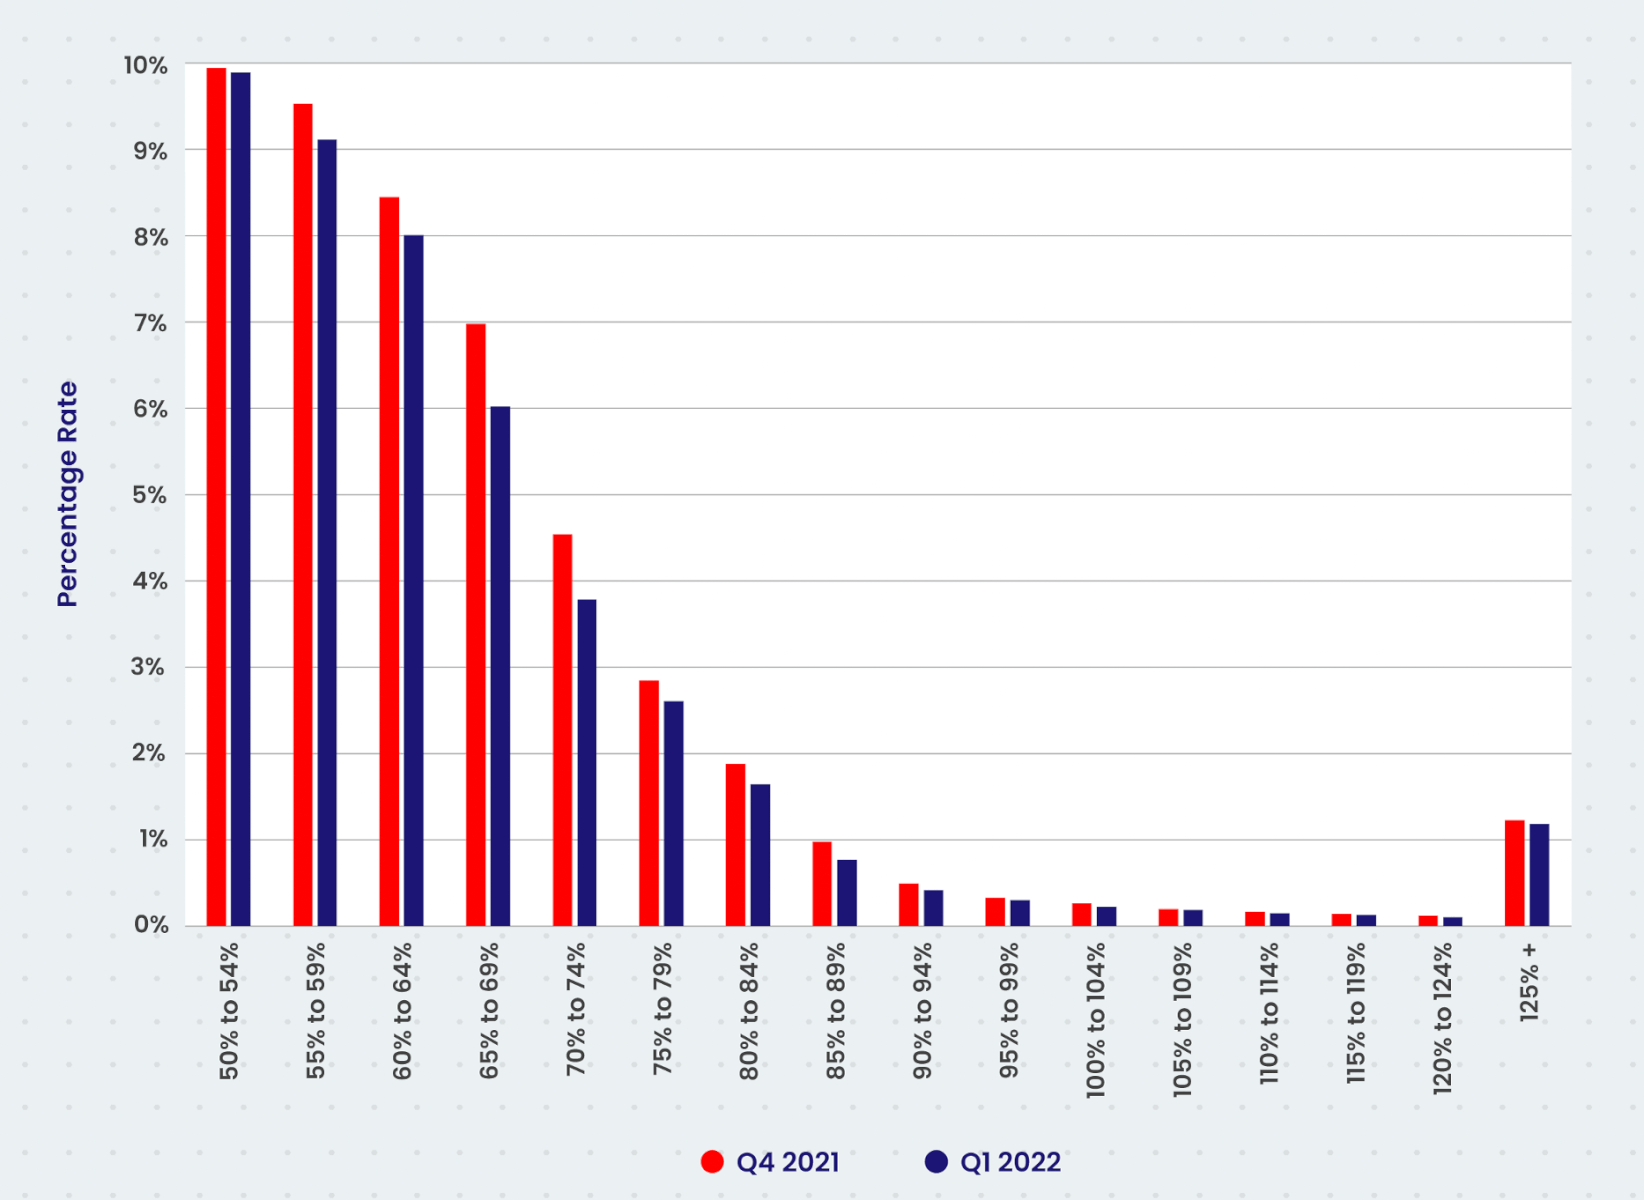
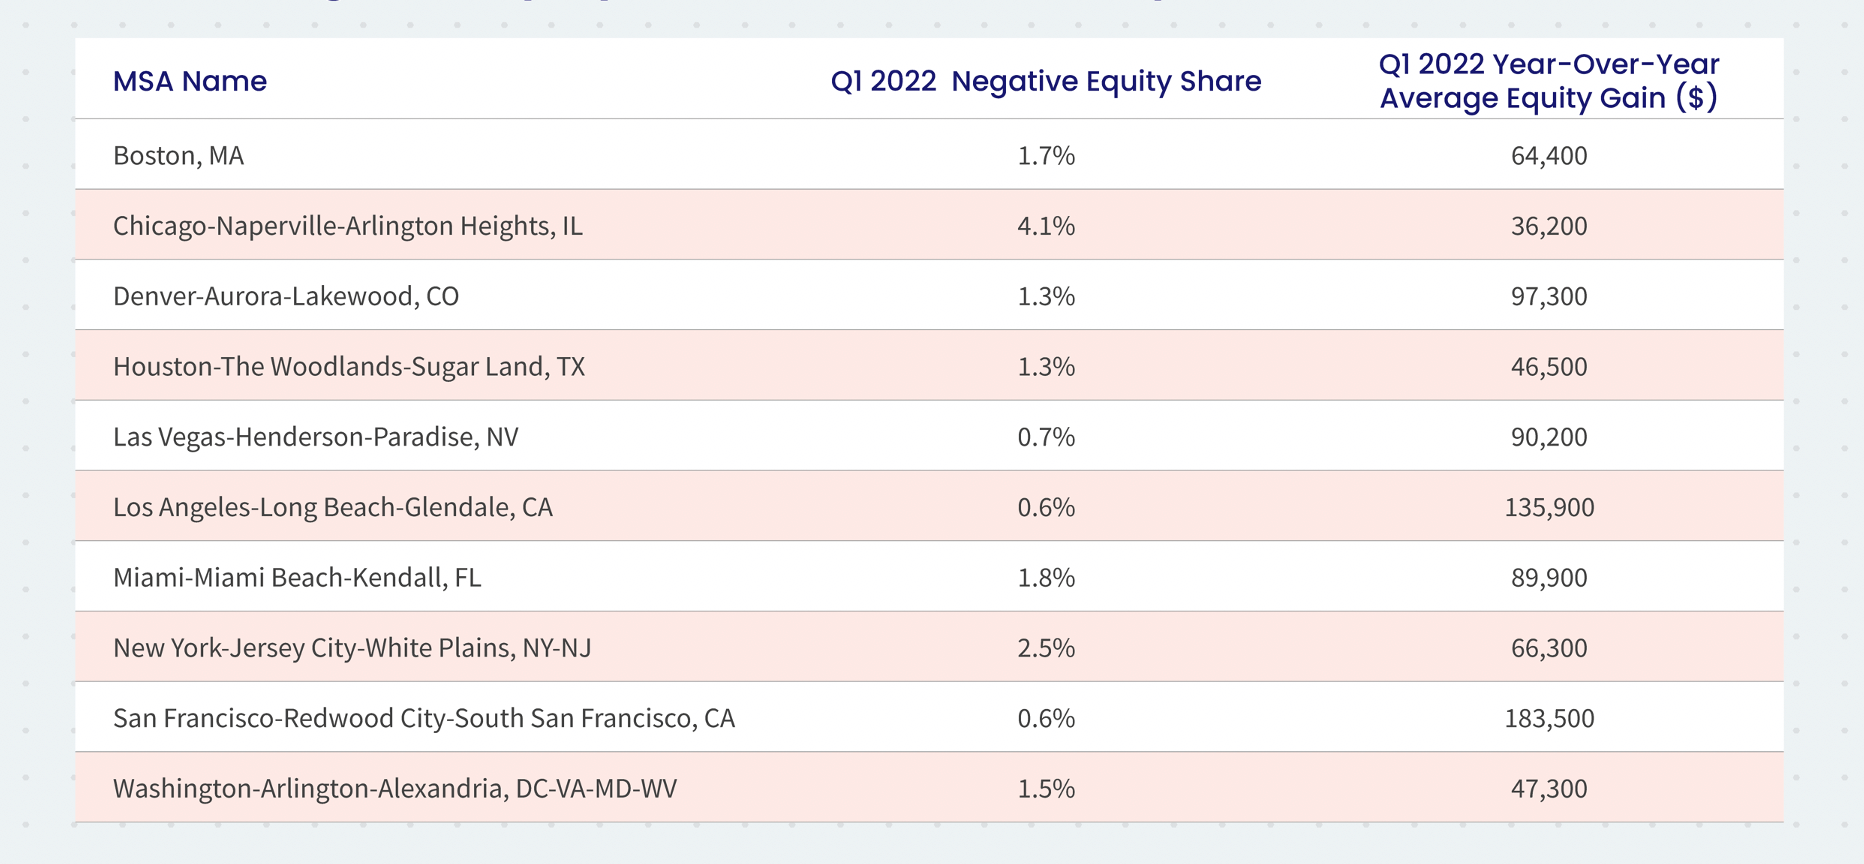
Figure 3: Negative Equity Share for Select Metropolitan Areas
Methodology
The amount of equity for each property is determined by comparing the estimated current value of the property against the mortgage debt outstanding (MDO). If the MDO is greater than the estimated value, then the property is determined to be in a negative equity position. If the estimated value is greater than the MDO, then the property is determined to be in a positive equity position. The data is first generated at the property level and aggregated to higher levels of geography. CoreLogic uses public record data as the source of the MDO, which includes more than 50 million first- and second-mortgage liens, and is adjusted for amortization and home equity utilization in order to capture the true level of MDO for each property. Only data for mortgaged residential properties that have a current estimated value are included. There are several states or jurisdictions where the public record, current value or mortgage data coverage is thin and have been excluded from the analysis. These instances account for fewer than 5% of the total U.S. population. The percentage of homeowners with a mortgage is from the 2019 American Community Survey. Data for the previous quarter was revised. Revisions with public records data are standard, and to ensure accuracy, CoreLogic incorporates the newly released public data to provide updated results.


