
CoreLogic®, a leading global property information, analytics and data-enabled solutions provider, today released the Homeowner Equity Report (HER) for the fourth quarter of 2022. The report shows that U.S. homeowners with mortgages (which account for roughly 63% of all properties) saw equity increase by 7.3% year over year, representing a collective gain of $1 trillion, for an average of $14,300 per borrower, since the fourth quarter of 2021.
As U.S. home price growth continued its slow, steady decline in the final months of 2022, home equity trends naturally followed suit. In the fourth quarter of 2022, the average borrower earned about $14,300 in equity year over year, compared with the $63,100 gain seen in the first quarter of 2022.


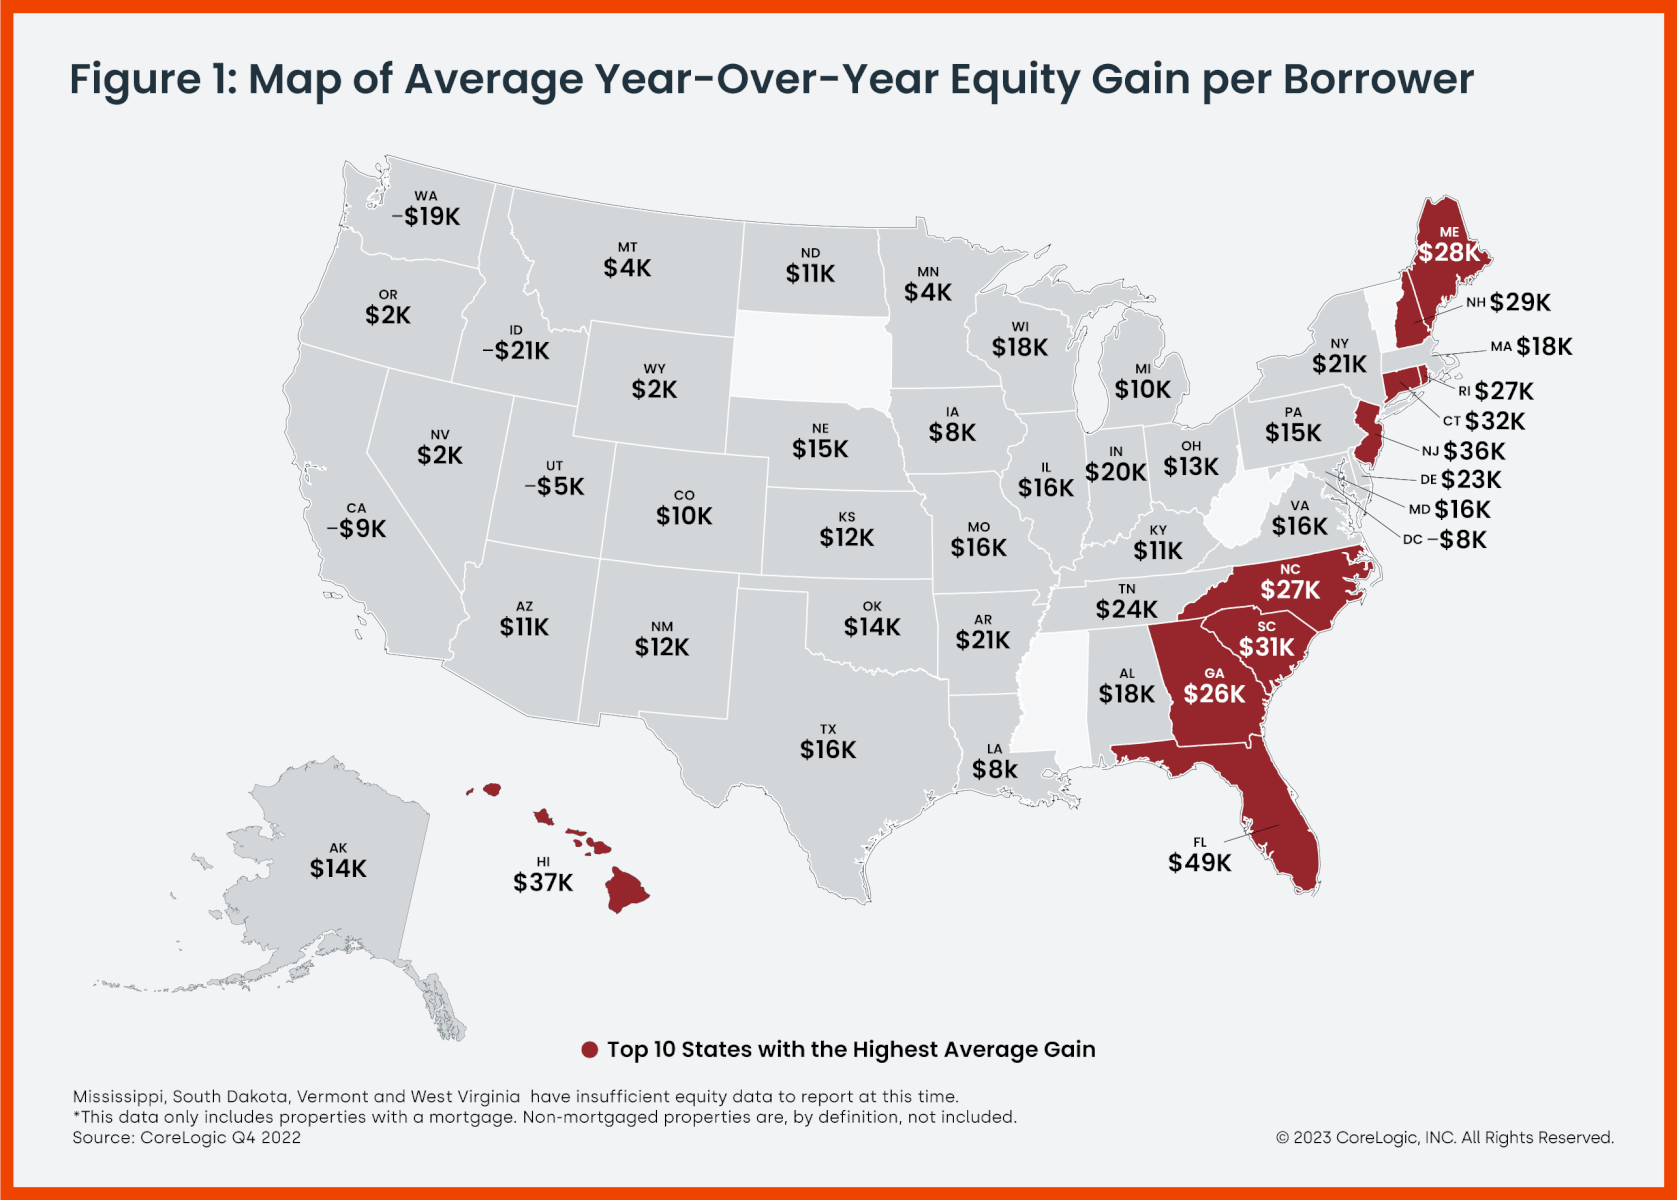
Four Western states and one district posted annual home equity decreases: Idaho (-$21,400), Washington (-$18,900), California (-$8,500), Utah (-$4,600) and Washington, D.C. (-$8,300). This partially mirrors trends recorded in CoreLogic’s latest Home Price Index (HPI), which found that Idaho, Washington and Washington, D.C. saw home price growth decline slightly year over year in January 2023.
On the flip side of the coin, Florida homeowners saw the highest annual equity growth in the fourth quarter, at $49,000. Florida has posted the largest year-over-year home price gains in the country for the past year, according to HPI data, with prices up by 13.4% in January.
“While equity gains contracted in late 2022 due to home price declines in some regions, U.S. homeowners on average still have about $270,000 in equity more than they had at the onset of the pandemic,” said Selma Hepp, chief economist at CoreLogic. “Even in Idaho, where borrowers were the most vulnerable to losses, the typical homeowner with a mortgage still has about $250,000 in remaining home equity.”
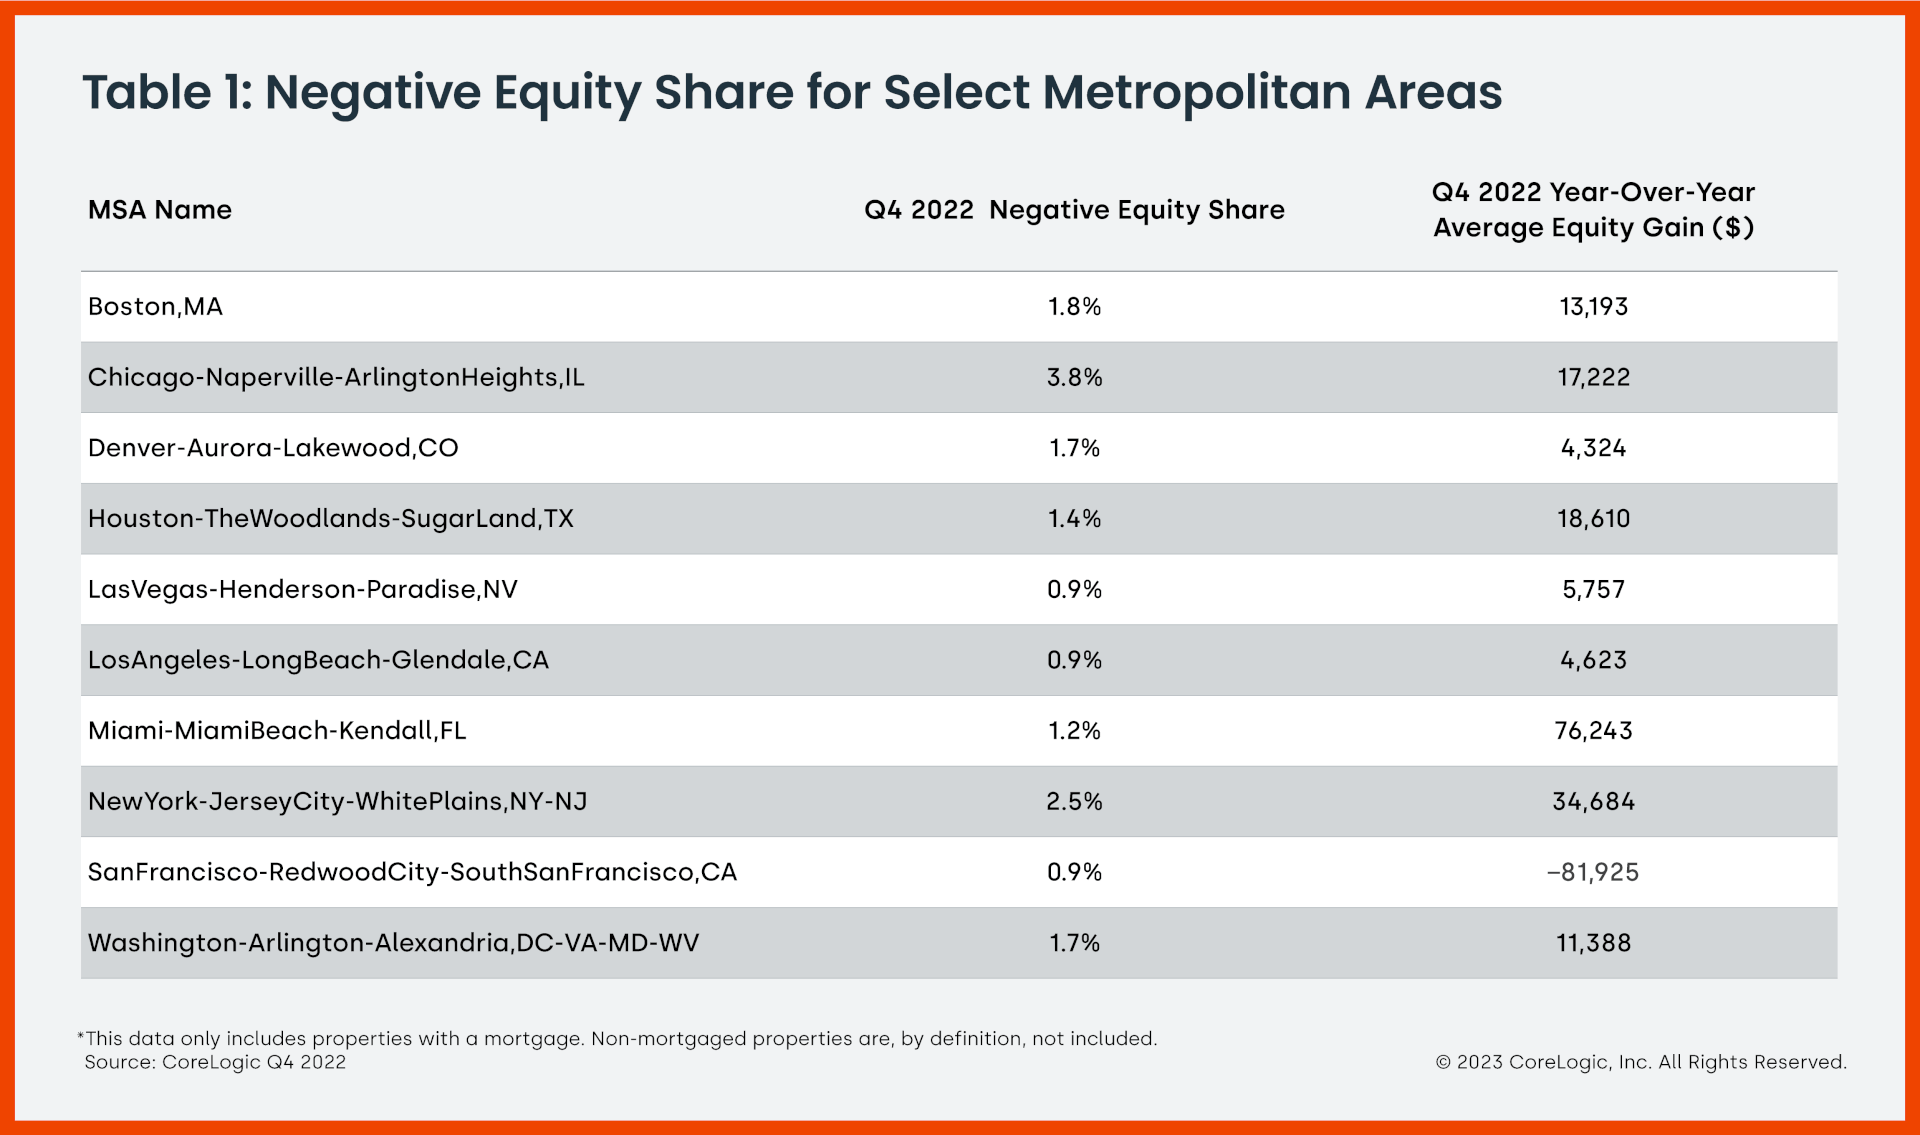
“Nevertheless, with 66,000 borrowers entering negative equity in the fourth quarter, the total number of underwater properties is now approaching levels seen at the end of 2021, which was the lowest since the Great Recession,” Hepp said. “The new hot spots for equity declines are largely markets that have seen the most significant home price deceleration, including Boise, Idaho; the San Francisco Bay Area; cities in Utah; Phoenix and Austin, Texas.”
Negative equity, also referred to as underwater or upside-down mortgages, applies to borrowers who owe more on their mortgages than their homes are currently worth. As of the fourth quarter of 2022, the quarterly and annual changes in negative equity were:
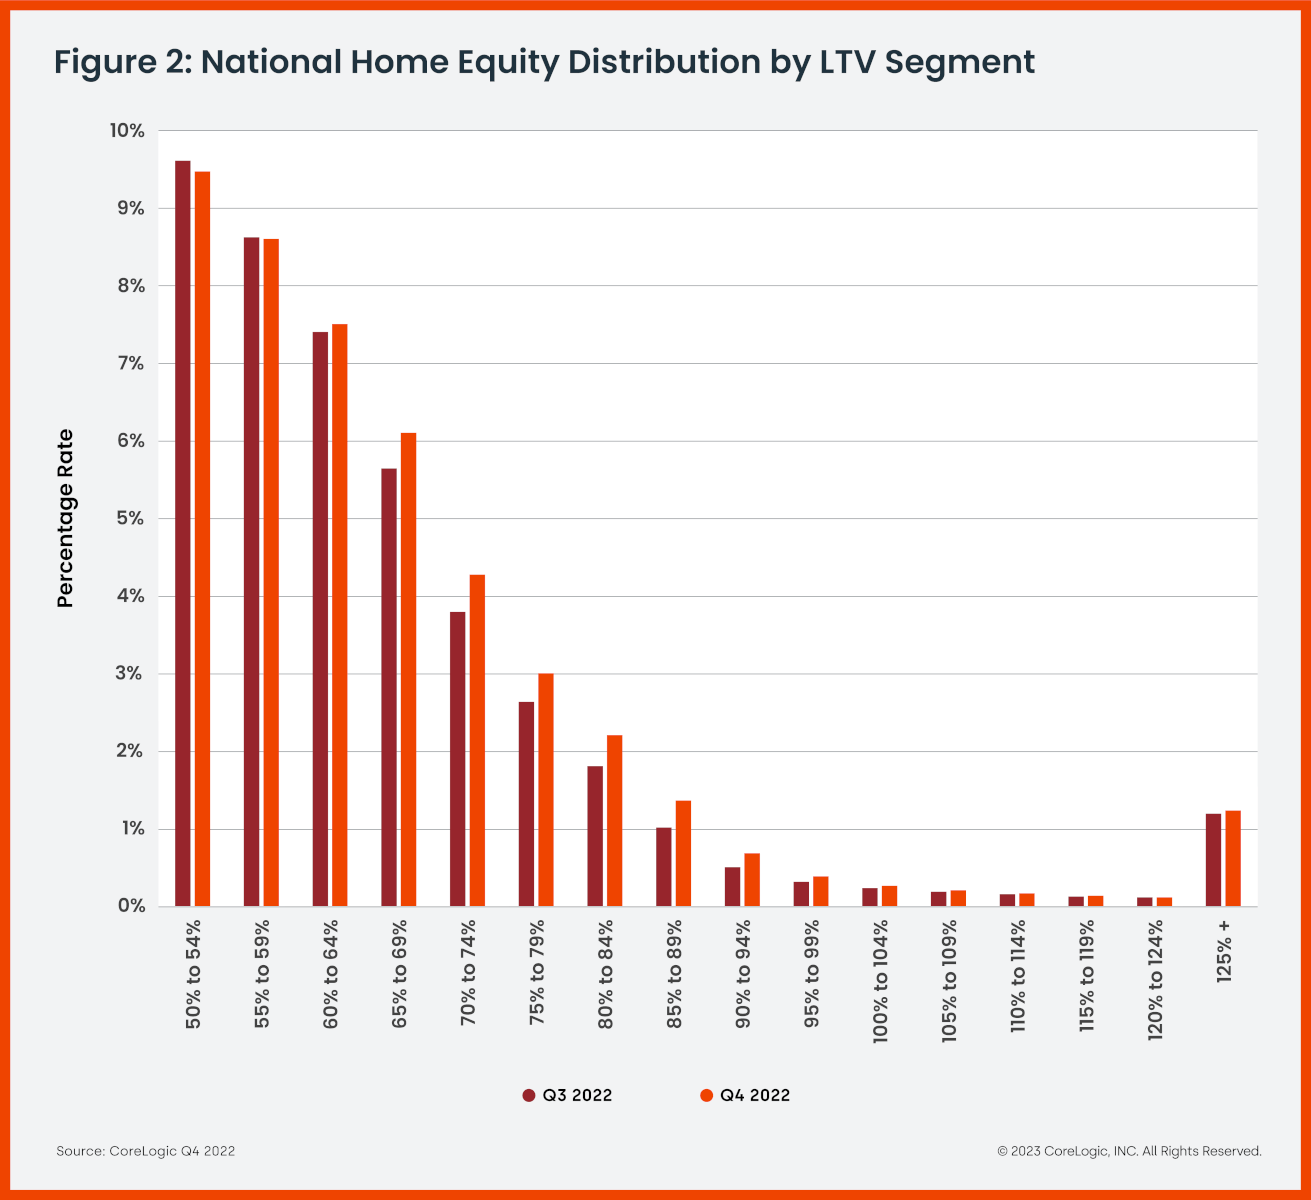
- Quarterly change: From the third quarter of 2022 to the fourth quarter of 2022, the total number of mortgaged homes in negative equity increased by 6%, to 1.2 million homes or 2.1% of all mortgaged properties.
- Annual change: From the fourth quarter of 2021 to the fourth quarter of 2022, the total number of homes in negative equity declined by 2% to 1.2 million homes or 2.2% of all mortgaged properties.
Because home equity is affected by home price changes, borrowers with equity positions near (+/- 5%), the negative equity cutoff, are most likely to move out of or into negative equity as prices change, respectively. Looking at the fourth quarter of 2022 book of mortgages, if home prices increase by 5%, 145,000 homes would regain equity; if home prices decline by 5%, 215,000 properties would fall underwater.
Methodology
The amount of equity for each property is determined by comparing the estimated current value of the property against the mortgage debt outstanding (MDO). If the MDO is greater than the estimated value, then the property is determined to be in a negative equity position. If the estimated value is greater than the MDO, then the property is determined to be in a positive equity position. The data is first generated at the property level and aggregated to higher levels of geography. CoreLogic uses public record data as the source of the MDO, which includes more than 50 million first- and second mortgage liens and is adjusted for amortization and home equity utilization in order to capture the true level of MDO for each property. Only data for mortgaged residential properties that have a current estimated value are included. There are several states or jurisdictions where the public record, current value or mortgage data coverage is thin and have been excluded from the analysis. These instances account for fewer than 5% of the total U.S. population. The percentage of homeowners with a mortgage is from the 2019 American Community Survey. Data for the previous quarter was revised. Revisions with public records data are standard, and to ensure accuracy, CoreLogic incorporates the newly released public data to provide updated results.


