
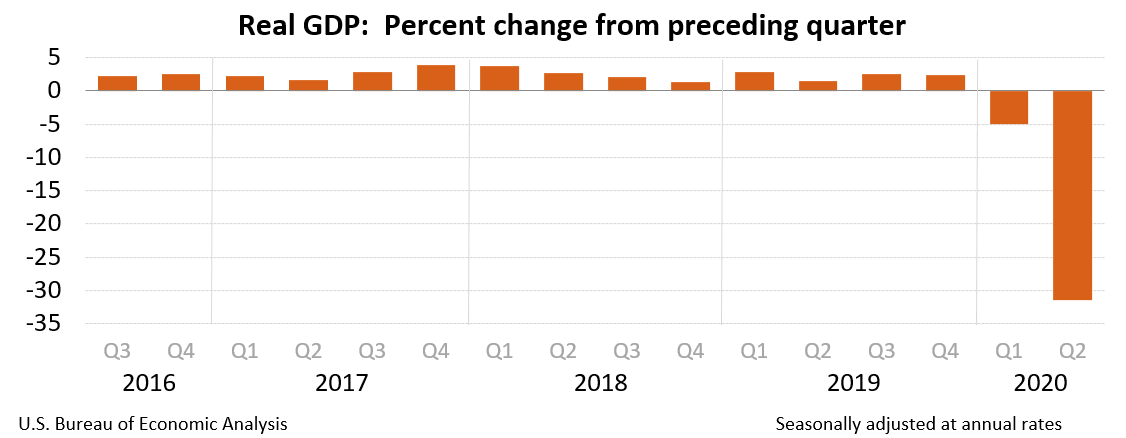
Real gross domestic product (GDP) decreased at an annual rate of 31.4 percent in the second quarter of 2020 (table 1), according to the “third” estimate released by the Bureau of Economic Analysis. In the first quarter, real GDP decreased 5.0 percent.
The “third” estimate of GDP released today is based on more complete source data than were available for the “second” estimate issued last month. In the second estimate, the decrease in real GDP was 31.7 percent. The upward revision with the third estimate primarily reflected an upward revision to personal consumption expenditures (PCE) that was partly offset by downward revisions to exports and to nonresidential fixed investment (see “Updates to GDP” on page 3).


The decrease in real GDP reflected decreases in PCE, exports, nonresidential fixed investment, private inventory investment, residential fixed investment, and state and local government spending that were partly offset by an increase in federal government spending. Imports, which are a subtraction in the calculation of GDP, decreased (table 2).
The decrease in PCE reflected decreases in services (led by health care) and goods (led by clothing and footwear). The decrease in exports primarily reflected a decrease in goods (led by capital goods). The decrease in nonresidential fixed investment primarily reflected a decrease in equipment (led by transportation equipment). The decrease in private inventory investment primarily reflected a decrease in retail (led by motor vehicle dealers). The decrease in residential investment primarily reflected decreases in new single-family housing.
Current-dollar GDP decreased 32.8 percent, or $2.04 trillion, in the second quarter to a level of $19.52 trillion. In the first quarter, GDP decreased 3.4 percent, or $186.3 billion (tables 1 and 3). More information on the source data that underlie the estimates is available in the “Key Source Data and Assumptions” file on BEA’s website.
The price index for gross domestic purchases decreased 1.4 percent in the second quarter, in contrast to an increase of 1.4 percent in the first quarter (table 4). The PCE price index decreased 1.6 percent, in contrast to an increase of 1.3 percent. Excluding food and energy prices, the PCE price index decreased 0.8 percent, in contrast to an increase of 1.6 percent.
Gross Domestic Income and Corporate Profits
Real gross domestic income (GDI) decreased 33.5 percent in the second quarter, compared with a decrease of 2.5 percent in the first quarter. The average of real GDP and real GDI, a supplemental measure of U.S. economic activity that equally weights GDP and GDI, decreased 32.5 percent in the second quarter, compared with a decrease of 3.7 percent in the first quarter (table 1).
Profits from current production (corporate profits with inventory valuation and capital consumption adjustments) decreased $208.9 billion in the second quarter, compared with a decrease of $276.2 billion in the first quarter (table 10).
Profits of domestic financial corporations increased $26.5 billion in the second quarter, in contrast to a decrease of $42.2 billion in the first quarter. Profits of domestic nonfinancial corporations decreased $145.9 billion, compared with a decrease of $190.5 billion. Rest-of-the-world profits decreased $89.5 billion, compared with a decrease of $43.5 billion. In the second quarter, receipts decreased $134.5 billion, and payments decreased $45.0 billion.
Updates to GDP
In the third estimate, the second-quarter change in real GDP was revised up 0.3 percentage point from the second estimate. PCE, residential investment, and state and local government spending were revised up. These upward revisions were partly offset by downward revisions to exports and to private nonresidential fixed investment (mainly intellectual property products). For more information, see the Technical Note and the “Additional Information” section that follows.
| Advance Estimate | Second Estimate | Third Estimate | |
|---|---|---|---|
| (Percent change from preceding quarter) | |||
| Real GDP | -32.9 | -31.7 | -31.4 |
| Current-dollar GDP | -34.3 | -33.3 | -32.8 |
| Real GDI | … | -33.1 | -33.5 |
| Average of Real GDP and Real GDI | … | -32.4 | -32.5 |
| Gross domestic purchases price index | -1.5 | -1.5 | -1.4 |
| PCE price index | -1.9 | -1.8 | -1.6 |
| PCE price index excluding food and energy | -1.1 | -1.0 | -0.8 |
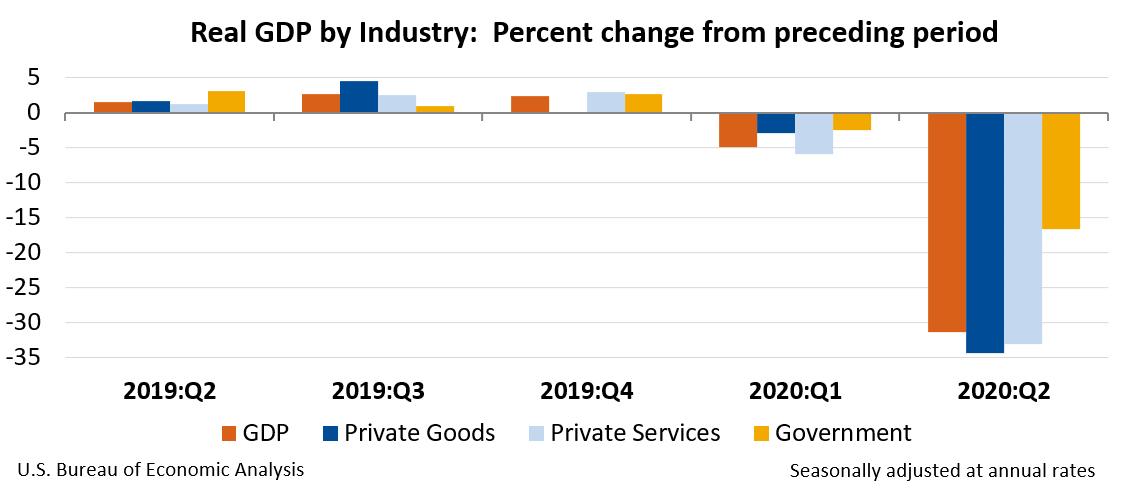
Real GDP by Industry
Today’s release includes estimates of GDP by industry, or value added—a measure of an industry’s contribution to GDP. Private goods-producing industries decreased 34.4 percent, private services-producing industries decreased 33.1 percent, and government decreased 16.6 percent (table 12). Overall, 20 of 22 industry groups contributed to the second-quarter decline in real GDP.
Within private goods-producing industries, the leading contributor to the decrease was durable goods manufacturing (led by motor vehicles, bodies and trailers, and parts) (table 13).
Within private services-producing industries, the leading contributors to the decrease were accommodation and food services (led by food services and drinking places); health care and social assistance (led by ambulatory health care); transportation and warehousing (led by air transportation); arts, entertainment, and recreation; wholesale trade; and professional, scientific, and technical services. Offsetting these decreases was an increase in finance and insurance (led by the securities and banking industries).
The decrease in government was more than accounted for by a decrease in state and local government which was partly offset by an increase in federal government.
Gross Output by Industry
Real gross output—principally a measure of an industry’s sales or receipts, which includes sales to final users in the economy (GDP) and sales to other industries (intermediate inputs)—decreased 29.5 percent in the second quarter. This reflected a decrease of 32.6 percent for private services-producing industries, a decrease of 29.7 percent for private goods-producing industries, and a decrease of 7.6 percent for government (table 16). Overall, 20 of 22 industry groups contributed to the decrease in real gross output. Finance and insurance as well as federal government gross output increased.
Annual Update of the Industry Economic Accounts
The industry estimates released today reflect the results of the 2020 Annual Update of the Industry Economic Accounts. The update covers the first quarter of 2015 through the first quarter of 2020. Major improvements introduced with this update include:
- Incorporation of the results from the 2020 Annual Update of the National Income and Product Accounts. For details on methodology improvements, major source data incorporated, and results, see “The 2020 Annual Update of the National Income and Product Accounts” in the August Survey of Current Business.
- Incorporation of newly available and revised source data, including the Census Bureau’s Service Annual Survey (SAS), the Bureau of Labor Statistics’ (BLS) Quarterly Census of Employment and Wages, and the Department of Treasury’s Statistics of Income.
- Introduction of a new implicit price deflator for import duties recorded in wholesale trade that conceptually captures changes in both the price of the underlying duties as well as changes in duty rates to improve the deflation of customs duties.
- Adoption of several retail trade producer price indexes (PPIs) due to the discontinuation of various detailed retail trade industries in the BLS PPI program.
- Incorporation of new educational services output indicators based on SAS revenue and taxable and tax-exempt expense data.
- Adoption of new commercial fishing indicators for quarterly estimates from 2017 onward using BLS PPIs and Census Manufacturers’ Shipments, Inventories, and Orders (M3) survey data due to the discontinuation of National Oceanic and Atmospheric Administration data on monthly commercial fishing landings and prices.
The full results of the annual update of the industry economic accounts, including updated annual supply-use tables, can be found on the BEA Web site. Additional information will be available in an article in the October 2020 issue of the Survey of Current Business.


