Phoenix’s construction market continued to gain momentum throughout Q2 2026, driven by sharpening industrial fundamentals, accelerating tenant improvement activity and a tightening supply picture across retail and office, even as tariff-driven cost pressures on metals and long-lead electrical equipment require early procurement planning, according to LGE Design Build’s newly released Q2 2026 Construction Delivery Outlook Report.


“Industrial demand in Phoenix is as strong as we’ve seen in recent memory, and the buildout opportunity beyond industrial is growing,” said Blake Wells, vice president of preconstruction at LGE Design Build. “Tenant improvement, mixed-use and emerging asset classes like industrial outdoor storage are generating real construction volume, and owners are increasingly finding the financing to act on it.”
Through Q2 2026, the Phoenix market continued its disciplined transition toward stabilization. Following a historic wave of deliveries, fundamentals across industrial, office and retail improved as supply decelerated and demand remained steady.
Industrial
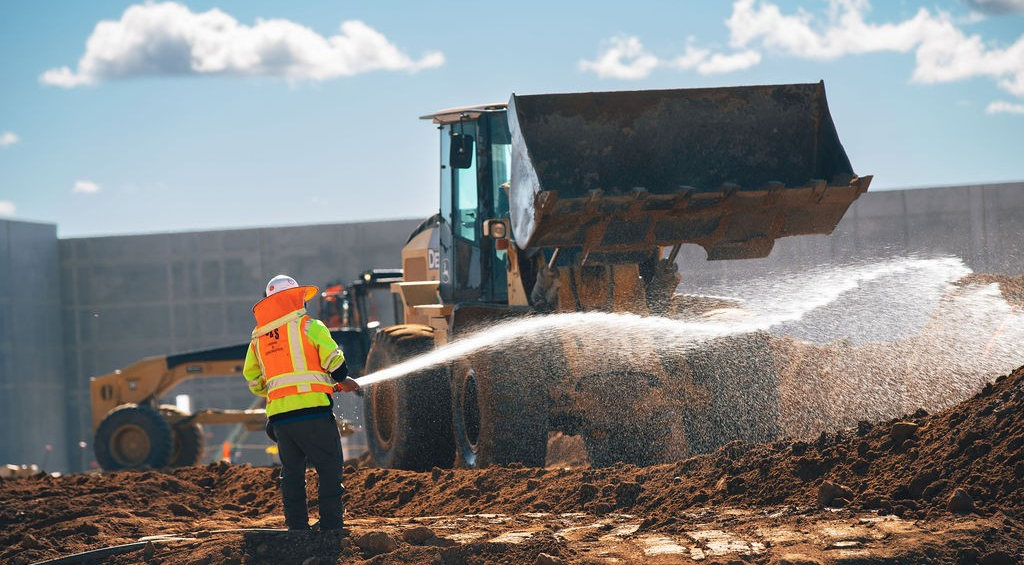
- Phoenix’s industrial market posted one of its strongest quarters in recent memory in Q1 2026, with 7.5 million square feet in total lease transactions and 4.4 million square feet absorbed. New deliveries dropped 82% year-over-year to just 1.2 million square feet – the lightest volume since Q1 2019 – while vacancy fell 120 basis points to 12.4% and asking rents rose 5% to $1.18 PSF NNN.
- Glendale, North Chandler/Gilbert and Goodyear lead the submarket recovery, driven by advanced manufacturing and logistics expansion, while West Phoenix remains the most active zone for new warehouse and distribution construction.
Office
- The Phoenix office market continued its early recovery, with vacancy falling 50 basis points to 22.8%, absorption more than doubling from Q4 2025, asking rents holding at $31.40 per square foot and just 410,000 square feet underway as landlords invested aggressively in spec suites, amenity buildouts and renovations to compete for quality tenants.
- Nationally, new office loan volume grew 181% year-over-year through Q3 2025 – one of the largest increases among property types.
Retail & Mixed-Use/Hospitality
- Phoenix retail remained the tightest commercial sector in the metro, with vacancy at 4.5% in Q1 2026 and asking rents climbing nearly 7% year-over-year to $1.73 per square foot per month. The pipeline declined more than 22% year-over-year, and retail loan volume grew 100% year-over-year.
- Phoenix’s hospitality pipeline was up 19% year-over-year – one of the most active in the country – with Downtown Phoenix, North Phoenix near the TSMC campus and several West Valley submarkets seeing the highest concentration of mixed-use and hospitality activity.
Two of the most active construction segments in Phoenix are tenant improvement (TI) and industrial outdoor storage (IOS), both driven by tenants investing in and around their space to support growing logistics and infrastructure needs.
Tenant Improvement
- With virtually no new Class A office construction underway and absorption positive across multiple consecutive quarters, TI emerged as the dominant form of buildout activity, with industrial users tied to TSMC’s semiconductor ecosystem requiring power upgrades, industrial office buildouts, dock modifications and advanced mechanical systems.
- National TI benchmarks in 2026 average $80-$140 per square foot for standard office builds and $150-$380 per square foot for medical and specialty suites, driven by energy code requirements and rising labor and material costs.
Industrial Outdoor Storage (IOS)
- IOS rents nationally increased 123% since 2020 – more than twice the rate of bulk warehouses – and Phoenix is at the center of the action, with fundamentals reinforced by semiconductor investment, cross-border trade flows and high demand for sites near major freeway corridors.
- Maricopa County’s updated zoning ordinance tightened industrial standards metro-wide, limiting new supply and placing a premium on existing sites and build-to-suit opportunities. The U.S. IOS market is projected to grow from $130 billion in 2025 to $200 billion by 2033.
Construction Labor
- Arizona’s construction labor market remained resilient through Q2 2026, with Phoenix metro employment averaging 42,300 workers in 2025 – a 6% year-over-year increase – and Phoenix ranking second nationally with 36 projects under construction as of Q1 2026.
- Nationally, the industry will need approximately 349,000 net new workers in 2026, down from over 500,000 in recent years, though competition for skilled trades in high-demand markets like Phoenix remains elevated.
Supply Chain & Material Costs
- The construction supply chain faced a more complex environment in Q2 than a year ago, with Section 232 tariff escalations and Strait of Hormuz disruptions driving diesel prices up more than 20% from January to February. Steel rose 20.7% year-over-year, aluminum surged 33% and copper and brass climbed 15.7% – the three largest category increases since early 2022, while electrical gear and large panel distribution boards carry lead times of 42-52 weeks in Arizona.
- The June 2025 doubling of Section 232 tariffs drove construction input prices to a 12.6% annualized rate in early 2026 – the fastest since 2022 – rippling through framing, electrical systems, mechanical equipment, curtain wall and roofing, while lumber, concrete block, gypsum and flat glass remained stable, providing a partial offset.


