
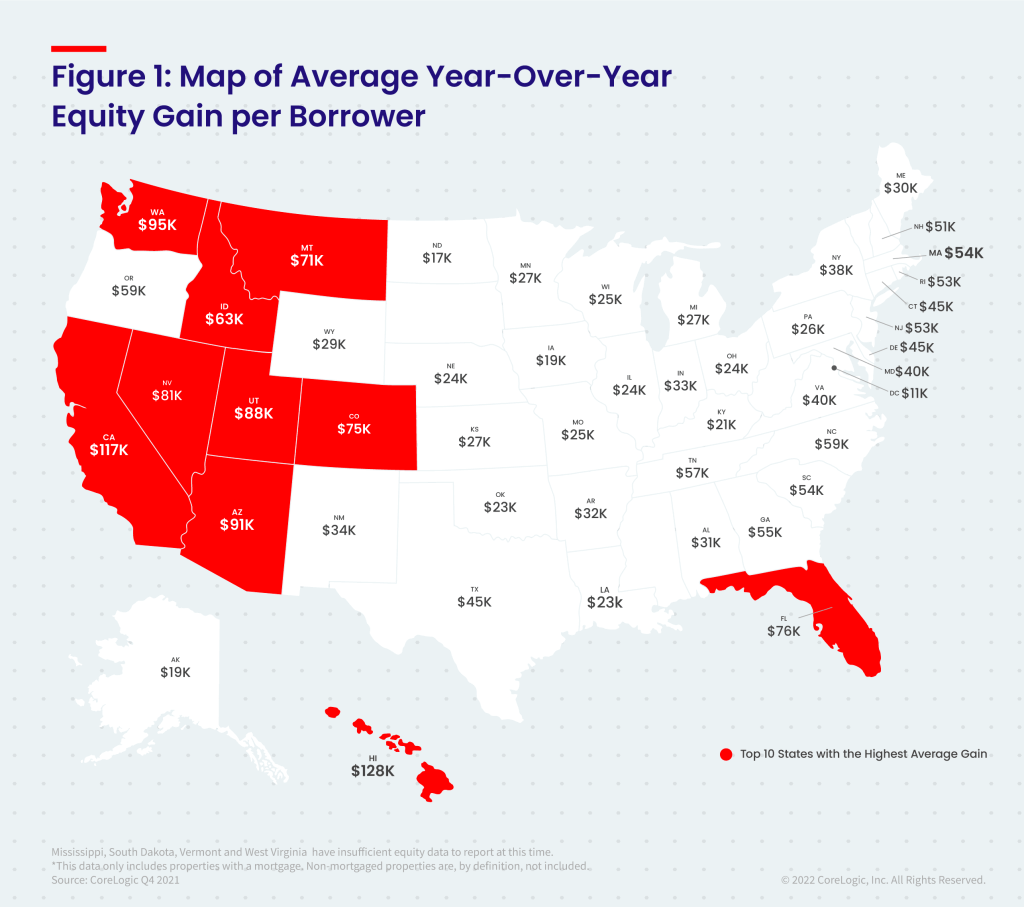
U.S. home prices rose 18% year over year in the fourth quarter of 2021, up from the 8% annual gain recorded in the fourth quarter of 2020. The appreciation helped push the national negative equity figure to the lowest in over a dozen years, with just 1.1 million homeowners underwater on their mortgages. Western state homeowners saw the biggest equity gains by dollar value, led by Hawaii, California and Washington. Year-over-year price appreciation increased by 19.1% in January 2022 according to CoreLogic’s latest Home Price Index, though growth is projected to eventually slow over the next 12 months.
“Home prices rose 18% during 2021 in the CoreLogic Home Price Index, the largest annual gain recorded in its 45-year history, generating a big increase in home equity wealth,” said Dr. Frank Nothaft, chief economist for CoreLogic. “For low- and moderate-income homeowners, home equity has historically been a major source of wealth.”


Negative equity, also referred to as underwater or upside-down mortgages, applies to borrowers who owe more on their mortgages than their homes are currently worth. As of the fourth quarter of 2021, negative equity share, and the quarter-over-quarter and year-over-year changes, were as follows:
• Quarterly change: From the third quarter of 2021 to the fourth quarter of 2021, the total number of mortgaged homes in negative equity decreased by 3% to 1.1 million homes, or 2.1% of all mortgaged properties.
• Annual change: In the fourth quarter of 2020, 1.5 million homes, or 2.8% of all mortgaged properties, were in negative equity. This number decreased by 24.9%, or approximately 380,000 properties, by the fourth quarter of 2021.
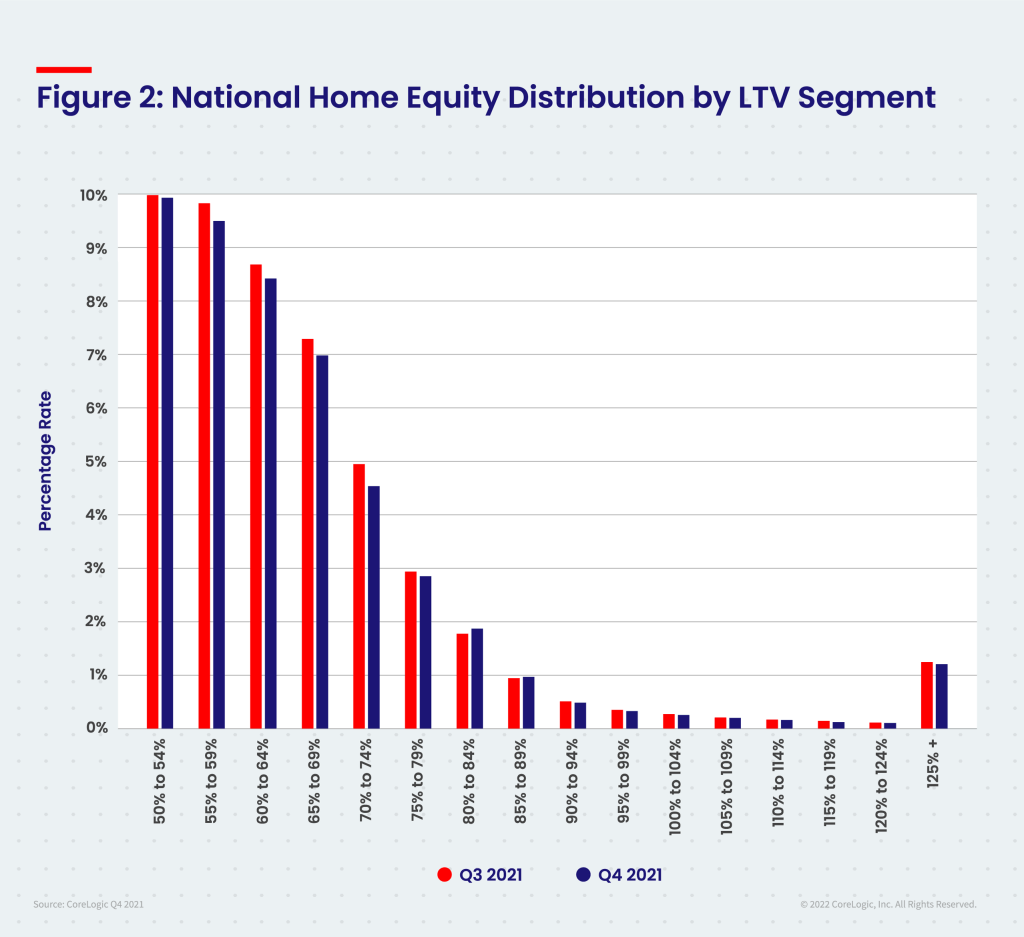
• Distribution of negative equity: Of loans in negative equity in the fourth quarter of 2021, 42% had a loan-to-value ratio below 125%, and 58% had a loan-to-value ratio of 125% or higher.
Because home equity is affected by home price changes, borrowers with equity positions near (+/- 5%) the negative equity cutoff are most likely to move out of or into negative equity as prices change, respectively. Looking at the fourth quarter of 2021 book of mortgages, if home prices increase by 5%, 141,000 homes would regain equity; if home prices decline by 5%, 183,000 would fall underwater. The CoreLogic HPI Forecast TM projects home prices will increase 5% from December 2021 to December 2022.
Methodology
The amount of equity for each property is determined by comparing the estimated current value of the property against the mortgage debt outstanding (MDO). If the MDO is greater than the estimated value, then the property is determined to be in a negative equity position. If the estimated value is greater than the MDO, then the property is determined to be in a positive equity position. The data is first generated at the property level and aggregated to higher levels of geography. CoreLogic uses public record data as the source of the MDO, which includes more than 50 million first- and second-mortgage liens, and is adjusted for amortization and home equity utilization in order to capture the true level of MDO for each property. Only data for mortgaged residential properties that have a current estimated value are included. There are several states or jurisdictions where the public record, current value or mortgage data coverage is thin and have been excluded from the analysis. These instances account for fewer than 5% of the total U.S. population. The percentage of homeowners with a mortgage is from the 2019 American Community Survey. Data for the previous quarter was revised. Revisions with public records data are standard, and to ensure accuracy, CoreLogic incorporates the newly released public data to provide updated results.


