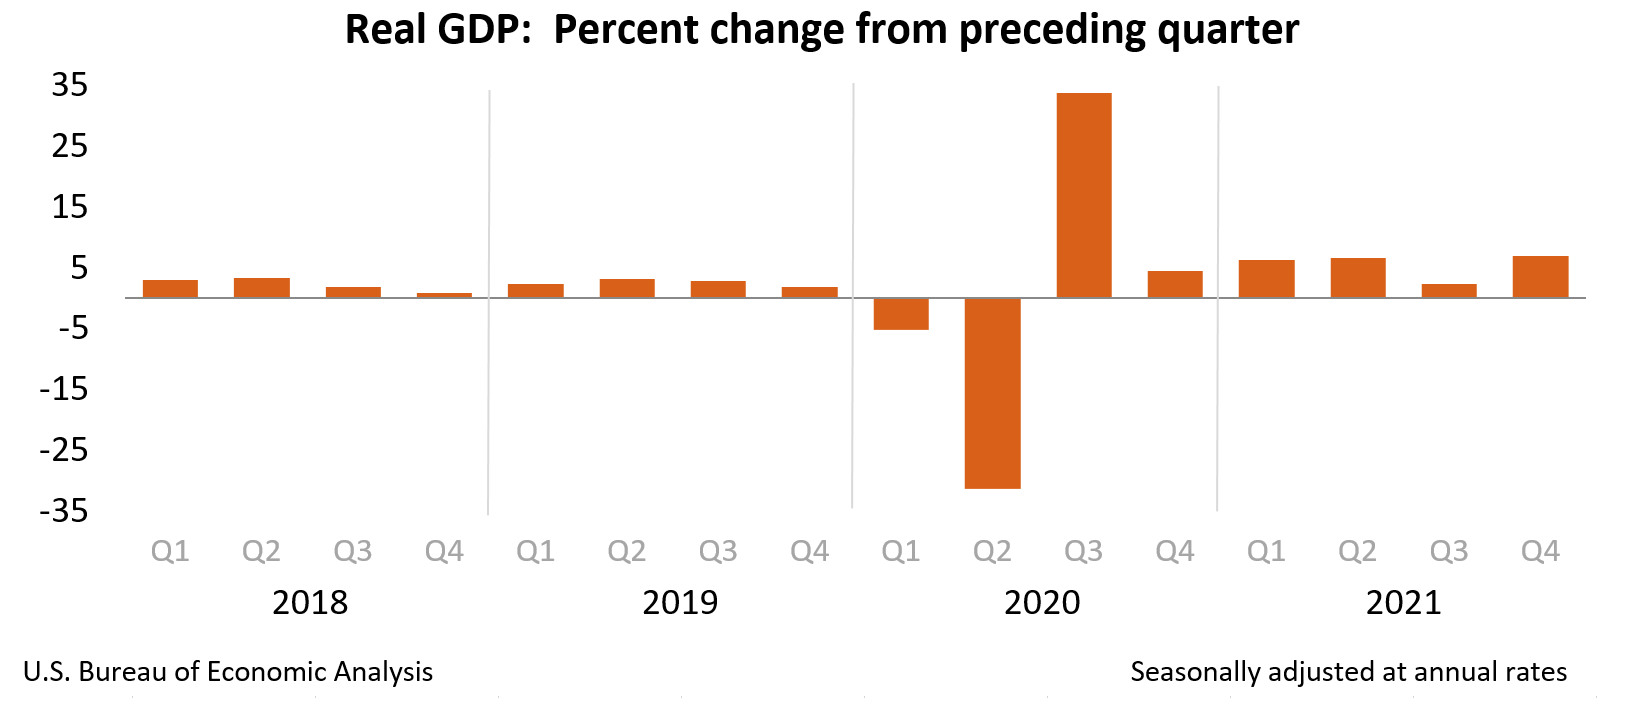
Real gross domestic product (GDP) increased at an annual rate of 6.9 percent in the fourth quarter of 2021 (table 1), according to the “advance” estimate released by the Bureau of Economic Analysis. In the third quarter, real GDP increased 2.3 percent. For the full year, the economic expansion was 5.7 percent, the biggest since 1984.
The GDP estimate released today is based on source data that are incomplete or subject to further revision by the source agency. The “second” estimate for the fourth quarter, based on more complete data, will be released on February 24, 2022.


The increase in real GDP primarily reflected increases in private inventory investment, exports, personal consumption expenditures (PCE), and nonresidential fixed investment that were partly offset by decreases in both federal and state and local government spending. Imports, which are a subtraction in the calculation of GDP, increased.
The increase in private inventory investment was led by retail and wholesale trade industries. Within retail, inventory investment by motor vehicle dealers was the leading contributor. The increase in exports reflected increases in both goods and services. The increase in exports of goods was widespread, and the leading contributors were consumer goods, industrial supplies and materials, and foods, feeds, and beverages. The increase in exports of services was led by travel. The increase in PCE primarily reflected an increase in services, led by health care, recreation, and transportation. The increase in nonresidential fixed investment primarily reflected an increase in intellectual property products that was partly offset by a decrease in structures.
The decrease in federal government spending primarily reflected a decrease in defense spending on intermediate goods and services. The decrease in state and local government spending reflected decreases in consumption expenditures (led by compensation of state and local government employees, notably education) and in gross investment (led by new educational structures). The increase in imports primarily reflected an increase in goods (led by non-food and non-automotive consumer goods, as well as capital goods).
Real GDP accelerated in the fourth quarter, increasing 6.9 percent after increasing 2.3 percent in the third quarter. The acceleration in real GDP in the fourth quarter primarily reflected an upturn in exports, accelerations in private inventory investment and PCE, and smaller decreases in residential fixed investment and federal government spending that were partly offset by a downturn in state and local government spending. Imports accelerated.
Current‑dollar GDP increased 14.3 percent at an annual rate, or $790.1 billion, in the fourth quarter to a level of $23.99 trillion. In the third quarter, GDP increased 8.4 percent, or $461.3 billion.
The price index for gross domestic purchases increased 6.9 percent in the fourth quarter, compared with an increase of 5.6 percent in the third quarter. The PCE price index increased 6.5 percent, compared with an increase of 5.3 percent. Excluding food and energy prices, the PCE price index increased 4.9 percent, compared with an increase of 4.6 percent.
Personal Income
Current-dollar personal income increased $106.3 billion in the fourth quarter, compared with an increase of $127.9 billion in the third quarter. The increase primarily reflected increases in compensation (led by private wages and salaries), personal income receipts on assets, and rental income that were partly offset by a decrease in personal current transfer receipts (notably, government social benefits). Within government social benefits, the decrease was more than accounted for by a decrease in unemployment insurance, following the expiration of pandemic-related unemployment programs.
Disposable personal income increased $14.1 billion, or 0.3 percent, in the fourth quarter, compared with an increase of $36.7 billion, or 0.8 percent, in the third quarter. Real disposable personal income decreased 5.8 percent, compared with a decrease of 4.3 percent.
Personal saving was $1.34 trillion in the fourth quarter, compared with $1.72 trillion in the third quarter. The personal saving rate—personal saving as a percentage of disposable personal income—was 7.4 percent in the fourth quarter, compared with 9.5 percent in the third quarter.
GDP for 2021
Real GDP increased 5.7 percent in 2021 (from the 2020 annual level to the 2021 annual level), in contrast to a decrease of 3.4 percent in 2020 (table 1). The increase in real GDP in 2021 reflected increases in all major subcomponents, led by PCE, nonresidential fixed investment, exports, residential fixed investment, and private inventory investment. Imports increased.
The increase in PCE reflected increases in both goods and services. Within goods, the leading contributors were “other” nondurable goods (including games and toys as well as pharmaceuticals), clothing and footwear, and recreational goods and vehicles. Within services, the leading contributors were food services and accommodations as well as health care. The increase in nonresidential fixed investment reflected increases in equipment (led by information processing equipment) and in intellectual property products (led by software as well as research and development) that were partly offset by a decrease in structures (widespread across most categories). The increase in exports reflected an increase in goods (mainly non-automotive capital goods) that was partly offset by a decrease in services (led by travel as well as royalties and license fees). The increase in residential fixed investment mainly reflected an increase in new single family construction. The increase in private inventory investment primarily reflected an increase in wholesale trade (mainly in durable goods industries).
Current-dollar GDP increased 10.0 percent, or $2.10 trillion, in 2021 to a level of $22.99 trillion, in contrast to a decrease of 2.2 percent, or $478.9 billion, in 2020.
The price index for gross domestic purchases increased 3.9 percent in 2021, compared with an increase of 1.2 percent in 2020. Similarly, the PCE price index increased 3.9 percent, compared with an increase of 1.2 percent. Excluding food and energy prices, the PCE price index increased 3.3 percent, compared with an increase of 1.4 percent.
Measured from the fourth quarter of 2020 to the fourth quarter of 2021, real GDP increased 5.5 percent during the period, in contrast to a decrease of 2.3 percent from the fourth quarter of 2019 to the fourth quarter of 2020.
The price index for gross domestic purchases, as measured from the fourth quarter of 2020 to the fourth quarter of 2021, increased 5.5 percent, compared with an increase of 1.4 percent from the fourth quarter of 2019 to the fourth quarter of 2020. The PCE price index increased 5.5 percent, compared with an increase of 1.2 percent. Excluding food and energy, the PCE price index increased 4.6 percent, compared with an increase of 1.4 percent.
Source Data for the Advance Estimate
Information on the source data and key assumptions used in the advance estimate is provided in a Technical Note that is posted with the news release on BEA’s website. A detailed “Key Source Data and Assumptions” file is also posted for each release. For information on updates to GDP, refer to the “Additional Information” section that follows.


