U.S. home prices continued to post significant year-over-year gains in March, up by 20.9%, another record high. Even with the past year’s streak of double-digit price increases, annual gains are projected to slow to around 6% by next March, due in part to rising mortgage rates and higher home prices hampering affordability for some home shoppers. Buyers who closed on a property in March had a good chance of locking in mortgage rates around 4% or slightly lower. By late April, rates had moved up to more than 5%, a jump of about 30% from the same time last year and a trend that might derail more prospective buyers.
“The annual growth in the U.S. index was the largest we have measured in the 45-year history of the CoreLogic Home Price Index,” said Dr. Frank Nothaft, chief economist at CoreLogic. “Couple that price increase with the rapid rise in mortgage rates and buyer affordability has fallen sharply. In April, 30-year fixed mortgage rates averaged nearly 2 percentage points higher than one year earlier. With the growth in home prices, that means the monthly principal and interest payment to buy the median-priced home was up about 50% in April compared with last April.”


Top Takeaways:
- Nationally, home prices increased 20.9% in March 2022, compared to March 2021. On a month-over-month basis, home prices increased by 3.3% compared to February 2022.
- In March, annual appreciation of detached properties (22%) was 4.7 percentage points higher than that of attached properties (17.3%).
- Annual home price gains are forecast to slow to 5.9% by March 2023.
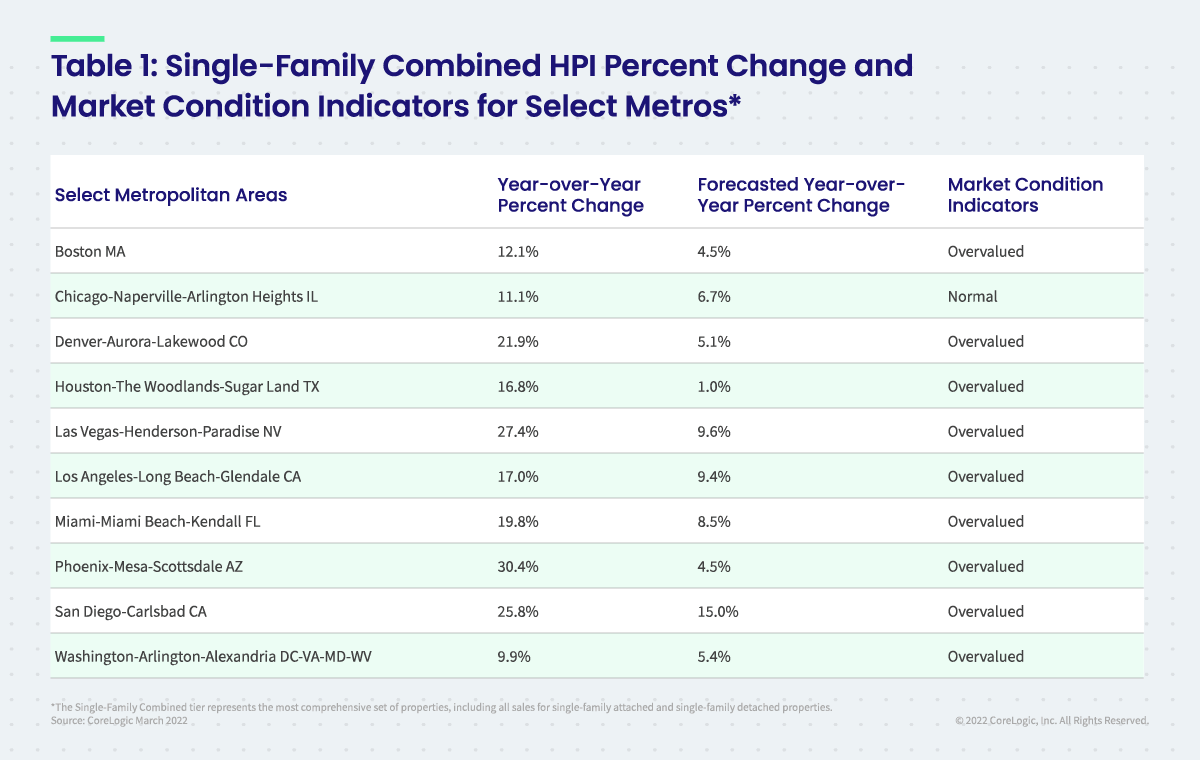
- In March, Tampa, Florida, logged the highest year-over-year home price increase of the country’s 20 largest metro areas at 32.5%. Phoenix ranked second with a 30.4% year-over-year gain. On the lower end of the price growth spectrum were the New York and Washington metro areas, both at 9.9%.
- Mirroring metro level trends, Florida and Arizona were the states with the highest home price gains, a respective 31.4% and 28.7%. Tennessee edged out Nevada for third place with a 26.7% increase in home price growth.
The next CoreLogic HPI press release, featuring April 2022 data, will be issued on June 7, 2022, at 8 a.m. ET.


Methodology
The CoreLogic HPI™ is built on industry-leading public record, servicing and securities real-estate databases and incorporates more than 45 years of repeat-sales transactions for analyzing home price trends. Generally released on the first Tuesday of each month with an average five-week lag, the CoreLogic HPI is designed to provide an early indication of home price trends by market segment and for the “Single-Family Combined” tier, representing the most comprehensive set of properties, including all sales for single-family attached and single-family detached properties. The indices are fully revised with each release and employ techniques to signal turning points sooner. The CoreLogic HPI provides measures for multiple market segments, referred to as tiers, based on property type, price, time between sales, loan type (conforming vs. non-conforming) and distressed sales. Broad national coverage is available from the national level down to ZIP Code, including non-disclosure states.


