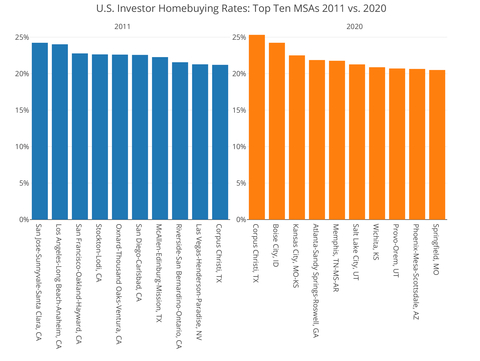
CoreLogic®, a leading global property information, analytics and data-enabled solutions provider, shared its Investor Homebuying report highlighting home U.S. purchase trends between 2011 and 2020. In the report, CoreLogic investigates activity nationally by both price tier and investor size and looks at which regions have had the most and least activity.
A decade ago, there was a flurry of home purchase activity following the 2006 housing market crash as investors began capitalizing on low-cost, high-growth properties. However, this purchase activity peaked in 2018 and since then, the pace of investment has slowed. In 2019, the investment rate (the share of home purchases made by investors) in the U.S. housing market was 16.3%, and by 2020, it had slowed to 15.5%.
Despite the decreasing rates, overall, investors have maintained a strong presence in the market during the last 10 years. Smaller investors are making up a more significant share of investors than at any point in the past and continue to gain their market share at the expense of their larger counterparts. This is likely due to large out-migration from expensive areas to more affordable ones, allowing smaller investors to snap up properties at lower rates.
“At this critical juncture — the first year into the new decade and continually moving farther away from the pandemic — when the hot housing market cools down, we may see investor activity increase as they try to buy more properties at lower prices,” said Molly Boesel, principal economist at CoreLogic. “Although investors seem to have given some of their coveted market share to buyers, it’s hard to say how long this trend will last — or what the long-term implications will be on a larger scale.”
State and Metro Takeaways
- California dominated investor activity in 2011, with Los Angeles, San Jose, San Diego, San Francisco, Sacramento, Stockton and Riverside all in the top 10 areas with the highest investor activity. Despite this, no California metro areas made the top 10 in 2020.
- Cities in the Mountain West, the western Midwest and the South led investment activity by 2020, and investment has grown in metro areas like Boise, Idaho; Phoenix and Salt Lake City, as they tend to have lower prices and growing populations fueled by out-migration in California.
- Conversely, investor activity was the lowest in the Northeast over the past decade, with eight of the bottom 10 metro areas representing the region. Hartford, Connecticut, had the lowest investor share at just 8%.
Methodology
This report uses the industry leading CoreLogic public record database. An investor is defined as an entity (individual or corporate) who retained three or more single-family properties simultaneously within the past 10 years. This report enhances the definition of an investor purchase that was introduced in a 2019 CoreLogic report. The previous report identified an investor purchase by looking for a corporate or non-individual identifier on the deed. Examples include LLCs, CORPs, and INCs, to name a few. This report includes those purchases but in addition, uses probabilistic record linkage methods to identify more investor purchases by seeing how many properties a person with the same name and address retains at any one time.
CoreLogic is a leading global property information, analytics and data-enabled solutions provider. The company’s combined data from public, contributory and proprietary sources includes over 4.5 billion records spanning more than 50 years, providing detailed coverage of property, mortgages and other encumbrances, consumer credit, tenancy, location, hazard risk and related performance information. The markets CoreLogic serves include real estate and mortgage finance, insurance, capital markets, and the public sector. CoreLogic delivers value to clients through unique data, analytics, workflow technology, advisory and managed services. Clients rely on CoreLogic to help identify and manage growth opportunities, improve performance and mitigate risk. Headquartered in Irvine, Calif., CoreLogic operates in North America, Western Europe and Asia Pacific.


Speak Your Mind
You must be logged in to post a comment.